What Is a Temperature Mapping Study?
A temperature mapping study measures how temperature actually behaves inside a defined space or shipment over a set period. Calibrated data loggers are placed at multiple points, a study runs for a representative window, and the output documents the real temperature distribution: the hot spots, the cold spots, and how far conditions drift under load. For a warehouse, that means a three-dimensional grid of sensors across a cold room. For transport, it means loggers riding a representative shipment along a route, capturing what the product experiences door to door.
The purpose is qualification. A mapping study produces documentary evidence that a specific setup, a cold room, a truck, a packaging configuration on a given route, can hold the required conditions, typically +2°C to +8°C for refrigerated product, under representative circumstances. It answers one question with real data: can this lane maintain temperature when we test it properly?
Mapping studies are a defined regulatory activity. World Health Organization (WHO) Technical Report Series (TRS) 961, Annex 9 covers both storage-area mapping and transport route profiling qualification directly. The United States Pharmacopeia (USP) has built out a dedicated series on it, with General Chapter <1079.4> on temperature mapping for qualification now official and a proposed <1079.5> covering transportation lane mapping and qualification specifically. The common thread across all of them: a mapping study is a point-in-time proof, repeated on a set cadence, that a lane performs the way it's supposed to.
What Is a Lane Risk Assessment?
A lane risk assessment scores the likelihood that a shipping route will fail, across every factor that can push it out of specification. Temperature is one input. So are customs hold patterns, cold storage availability at transfer points, carrier reliability on that exact lane, supplier quality, security exposure, and seasonal or geopolitical volatility. The assessment weighs all of it into a risk profile for the route, and it's built to be revisited as conditions move.
Where a mapping study captures what happened under test, a lane risk assessment estimates what is likely to happen next, given everything known about the route today. It's the difference between a photograph and a forecast. The photograph is precise about one moment. The forecast is the thing you actually plan around.
Good Distribution Practice (GDP) guidelines in the European Union, under Chapter 9, expect this kind of risk-based, evidence-backed approach to transport. A wholesale distributor has to show it understood the risks on a route and controlled for them. A mapping study covers one piece of that picture, temperature performance under representative conditions, and a broader risk assessment covers the rest.
The Core Difference in One Line
A temperature mapping study proves a lane can hold conditions. A lane risk assessment tracks whether it still does, and what else could go wrong.
Both are evidence. They sit at different points in the same process, and each answers a question the other can't.
| |
Temperature mapping study |
Lane risk assessment |
| Question it answers |
Can this lane maintain the required temperature under test? |
How likely is this lane to fail, across all risk factors? |
| What it measures |
Actual temperature distribution from calibrated loggers |
Temperature, plus customs, infrastructure, carrier reliability, supplier quality, security, and seasonality |
| Timing |
Point-in-time, repeated on a fixed cadence |
Ongoing, updated as conditions change |
| Output |
Documentary proof of performance under representative conditions |
A risk score and profile that informs the shipping decision |
| Regulatory anchor |
WHO TRS 961 Annex 9, USP <1079.4> and proposed <1079.5> |
EU GDP Chapter 9, WHO TRS 961 risk-based transport planning |
| What it can't do alone |
Account for conditions that change after the test |
Physically prove temperature performance on a route |
Where Teams Confuse the Two, and What It Costs
The most common mistake is treating a passed mapping study as a finished risk assessment. The study gets filed, the lane gets marked qualified, and the assumption becomes that the route is safe until the next scheduled requalification. Then a transfer point loses its cold storage, a monsoon season arrives, or a carrier quietly changes ground handlers, and none of it shows up in a document that was accurate the day it was signed.
The reverse mistake happens too. A team builds a detailed risk model from customs data, carrier scorecards, and seasonal patterns, then treats the resulting score as proof the lane holds temperature. It isn't. Without a mapping study behind it, a risk assessment is an informed estimate of temperature performance, and an auditor asking for physical evidence will notice the gap.
The two failures share a root cause: a mapping study captures a moment, and lane conditions don't stay in that moment. A study is accurate the day the loggers come off the shipment, and it starts aging immediately after. Everything that makes a lane risky, changing infrastructure, shifting customs rules, carrier drift, weather, moves faster than a requalification cadence can track. That's the space a live risk assessment is built to cover.
How the Two Work Together
A well-run lane uses both. A mapping study establishes that the route and packaging can perform, then ongoing risk assessment catches everything that changes after the study is done. Mapping sets the baseline. Risk assessment watches the baseline erode and flags when a lane needs attention, a packaging change, or a fresh study.
The practical failure mode is when the two live in different places. The mapping study is a PDF in a validation folder. The risk assessment is a spreadsheet on a shared drive, last updated by someone who has since left. Neither talks to the other, so a lane that failed a recent requalification can still read as low-risk in the workbook, and a lane flagged as high-risk can still be shipping against a mapping study from two years ago. The evidence exists. It just never meets in one view.
How Validaide Connects Mapping and Risk
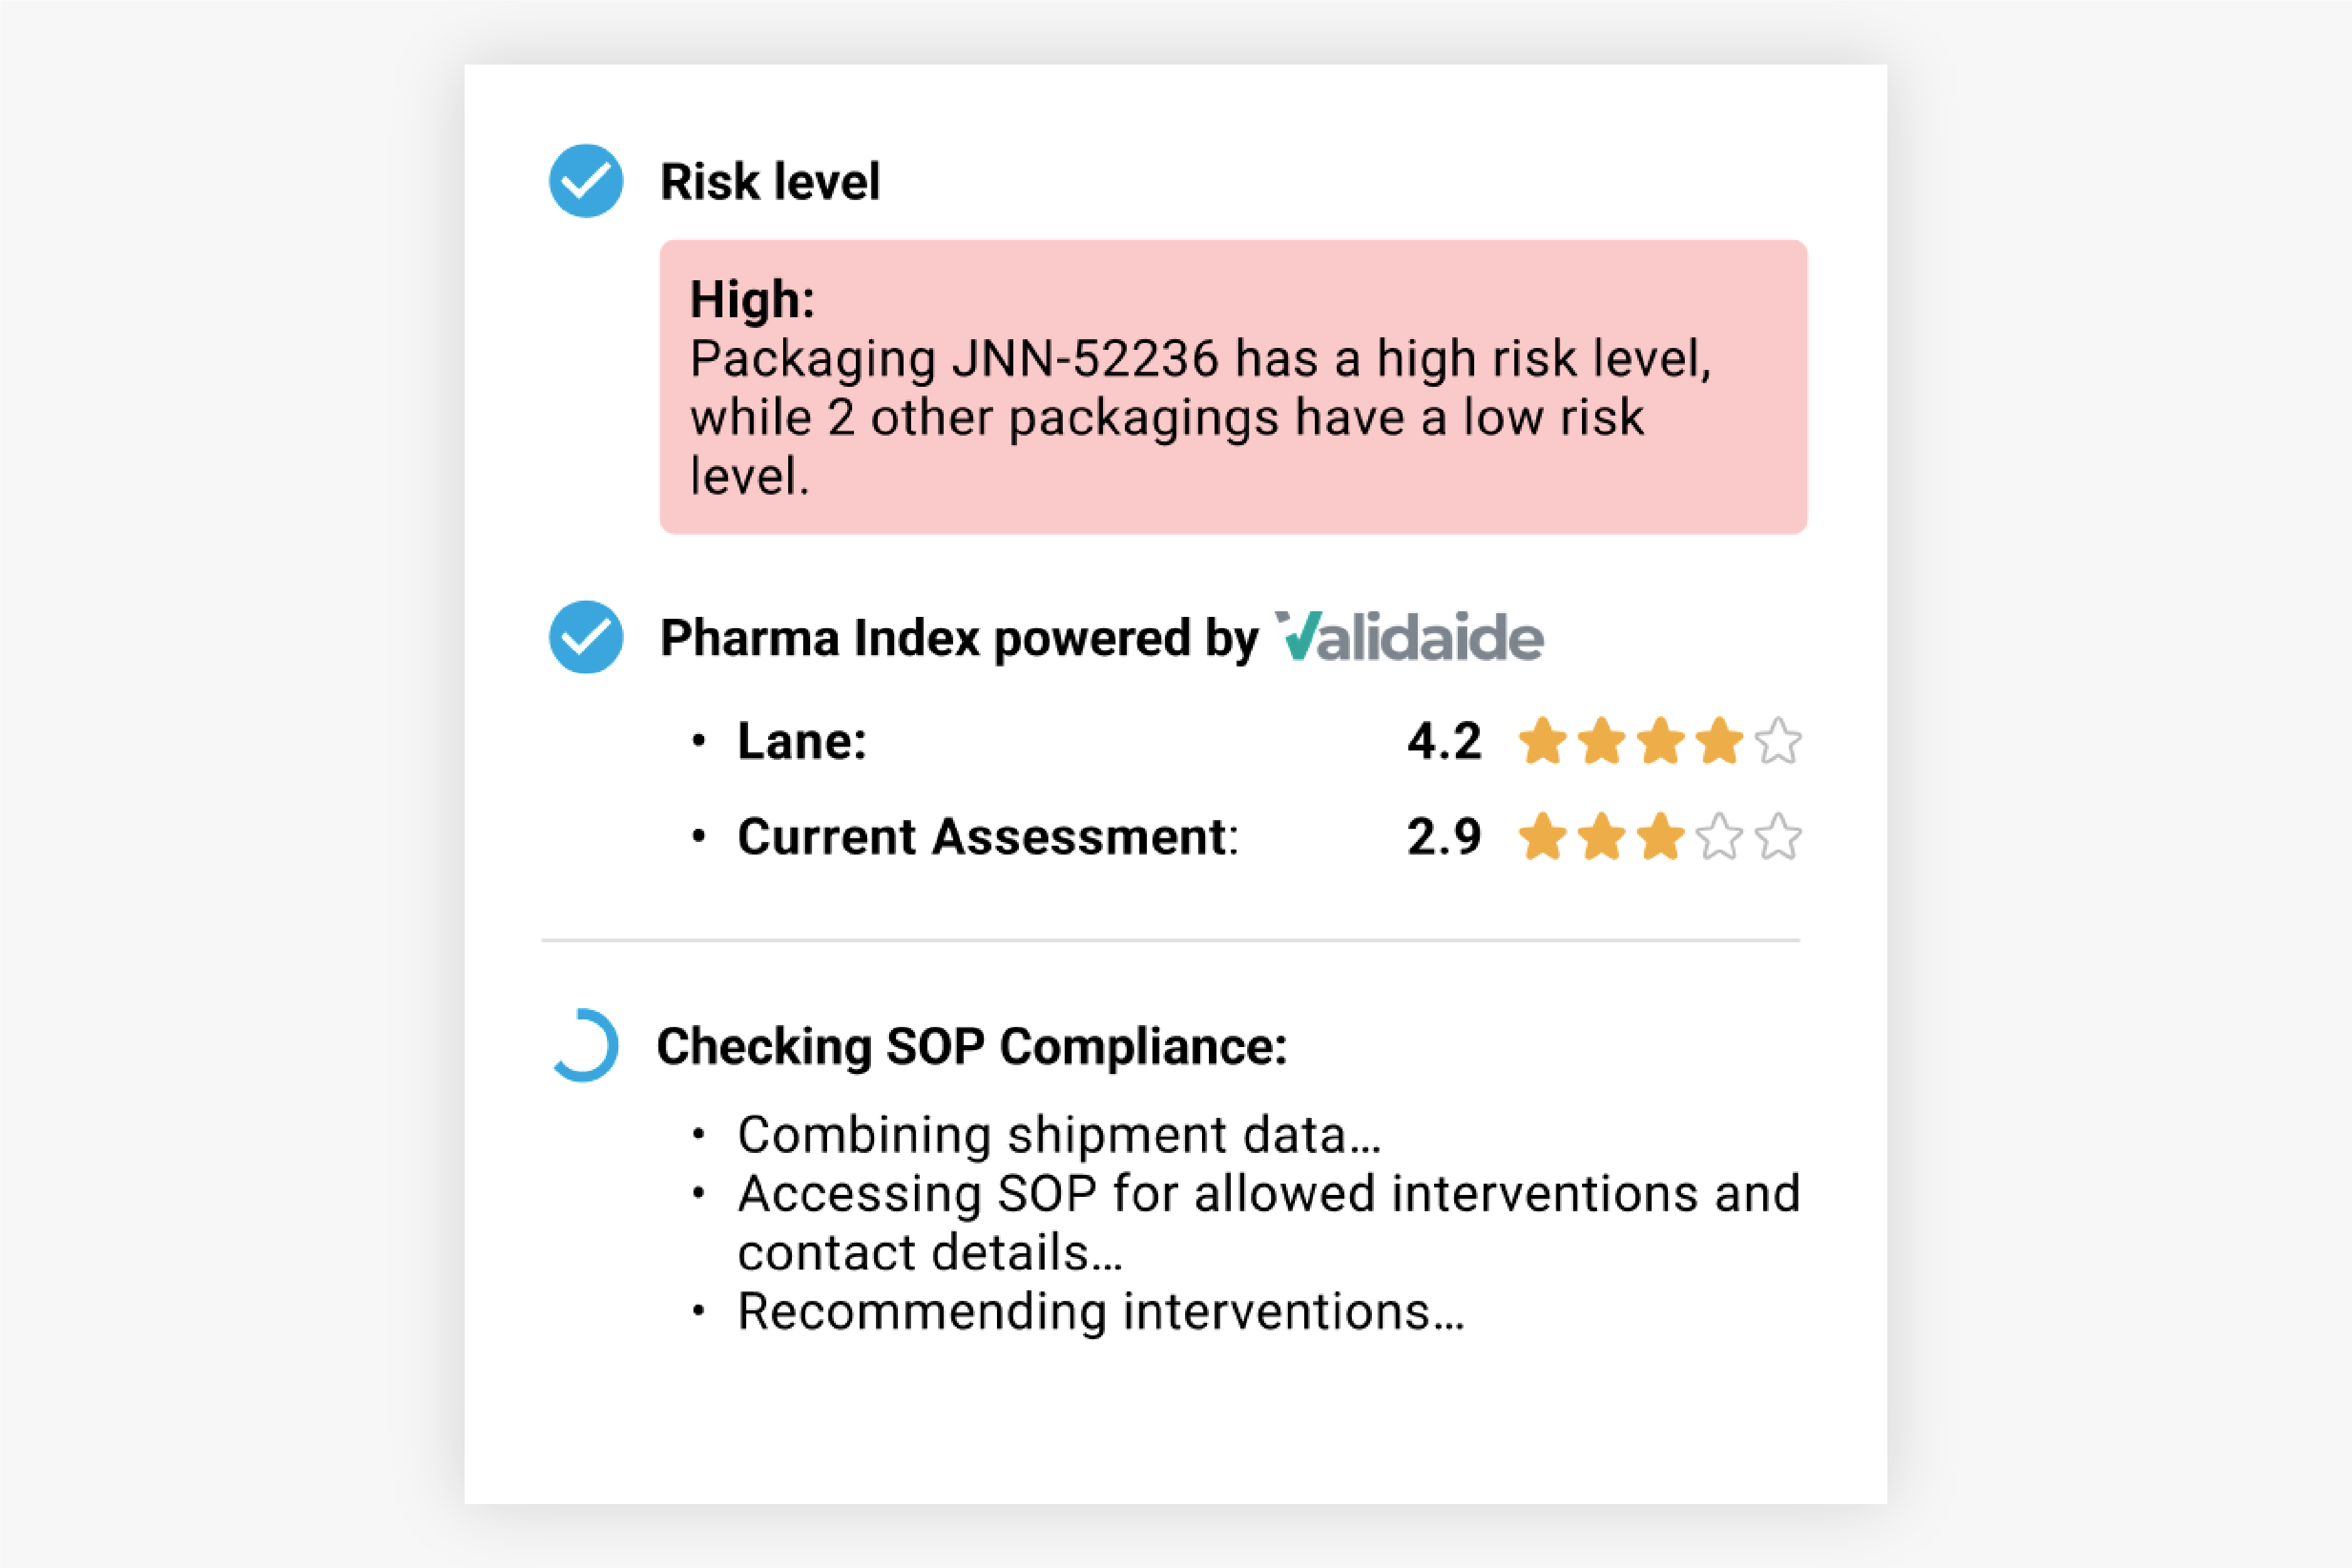
Validaide was built to keep these two evidence streams in the same place and current. Its Dynamic Pharma Index scores each lane across six factors, product temperature exposure, the protection a packaging solution actually provides, the pharma quality management of the suppliers involved, security, route duration and complexity, and the lane's real shipment performance over time. Temperature performance data, including the results of mapping and packaging qualification, feeds the score alongside operational and network data, so a lane's proven thermal performance and its live risk profile inform the same decision.
Because the score updates as conditions change, a lane doesn't sit at "qualified" until the next scheduled study. When a customs rule shifts, a carrier's performance drifts, or a new incident lands on a route, the risk profile moves, and the lane gets flagged for attention before a shipment moves against stale evidence. Validaide has run this across more than 60,000 pharmaceutical shipping lanes, backed by verified data from over 1,900 qualified suppliers, giving teams one place where a lane's proof of performance and its current risk actually meet.
References