What to Actually Weigh When Choosing a Lane Risk Solution
Most evaluations start with price or a features list. Start with these questions instead:
- Does it use the lane's own history, or a generic estimate? A route's real excursion and delay record predicts its future better than an average.
- Does the score update on its own, or only when someone remembers to redo it? A risk assessment from eighteen months ago is a guess wearing a lab coat.
- Does it cover packaging performance, supplier quality, and security, or just temperature? Temperature is necessary. It isn't sufficient.
- Can it scale past a handful of priority lanes? A method that works for twenty lanes and collapses at two thousand isn't a lane risk solution. It's a pilot.
- Is the output defensible in an audit? GDP and WHO TRS 961 both expect a risk-based, evidence-backed process, not a plausible-looking spreadsheet.
- Does it separate one-time qualification from ongoing risk monitoring? Proving a lane can work and confirming it still does are two different questions, and a solution that only answers the first one is only doing half the job.
Why Manual Assessment Still Falls Short
Most pharma companies didn't choose spreadsheets. They inherited them, one urgent lane at a time, until the method became permanent by accident. The pattern is familiar: a QA or planning lead pulls carrier performance from one email thread, customs history from another, and packaging validation data from a PDF someone sent eight months ago, then reconciles all of it by hand into a workbook that becomes the official record. It works, in the sense that it produces a number. It doesn't scale, and it doesn't stay true.
The problems that come with it are consistent across the industry: qualification takes weeks, updates happen only when someone remembers, and every partner ends up interpreting risk differently because there's no shared standard behind the numbers. One team's "low risk" is another team's "we'd never approve that." The workbook itself becomes a liability. Whoever built the formulas eventually leaves, the version on the shared drive is rarely the version everyone thinks they're looking at, and nobody notices a lane assessment has gone stale until an auditor asks for the evidence behind it.
The result is a lane risk assessment that's accurate on the day it's finished and increasingly wrong every day after. Routes change. Carriers change. A transfer point that had cold storage last year might not this year. None of that gets captured in a document that only gets opened again when someone remembers to.

From Spreadsheets to Purpose-Built Software
Software entered this problem from three different directions, and the differences matter more than the fact that all three now use the phrase "lane risk."
Some tools started as simulation engines: model a shipment's thermal performance against a specific route's historical weather data, without necessarily connecting to live shipment or supplier data. Others started as IoT and monitoring platforms: put a logger in the box, get real-time temperature and location data back, and layer risk scoring on top of what the devices already report. A third group started as network orchestration platforms: treat lane risk as a live, shared score across every supplier, partner, and shipment on the network, updated as conditions change rather than recalculated on request.
Where a tool started still shows in what it does best today. A simulation engine is excellent at answering a narrow, physics-based question about one packaging choice on one lane. A monitoring platform is excellent at telling a team what actually happened to a shipment in transit. Neither was designed to hold a continuously current risk view across a thousand lanes and hundreds of suppliers at once, because that wasn't the problem they were built to solve.
Comparing the Main Approaches
| Solution |
Built around |
Lane risk data source |
How current the score stays |
Best fit |
| SmartCAE |
Thermal simulation / digital twin |
Historical and forecast weather from 20,000+ weather stations, modeled against packaging performance |
Recalculated per simulation run |
Testing packaging choice against a specific lane before shipping |
| Controlant |
IoT loggers and cold chain monitoring |
Real-time device data, plus lane risk and thermal simulation via its SmartCAE partnership |
Updated as new shipment and device data comes in |
Real-time visibility and exception response on monitored lanes |
| Paxafe |
AI-driven risk and decision intelligence |
Device-agnostic shipment and lane data, used to quantify risk and predict on-time performance |
Continuously scored as shipment data flows in |
Predictive risk scoring layered on top of existing monitoring data |
| Validaide |
Network orchestration for pharma logistics |
Verified data from 1,900+ qualified suppliers, packaging performance, and live shipment history across 60,000+ digitized lanes |
Dynamic — the score updates automatically as conditions and incidents occur |
Managing and defending risk across an entire global lane portfolio, not lane by lane |
Read the table by column, not just by row. "Lane risk data source" tells you whose evidence the score is actually built from. "How current the score stays" tells you whether that evidence is still true by the time someone acts on it. A tool can score well on one column and poorly on the other, and for a network of any real size, the second column is usually where the risk actually hides.
Where Validaide Stands Apart
The distinction that matters most is what the score is built from and how often it's true. Validaide's Dynamic Pharma Index scores each lane across six factors: product temperature exposure, the protection a given packaging solution actually provides, the pharma quality management of the suppliers involved, security, the complexity of the route itself, and the lane's real shipment performance over time. That's a wider lens than temperature alone, and it's drawn from a live network rather than a single test run.
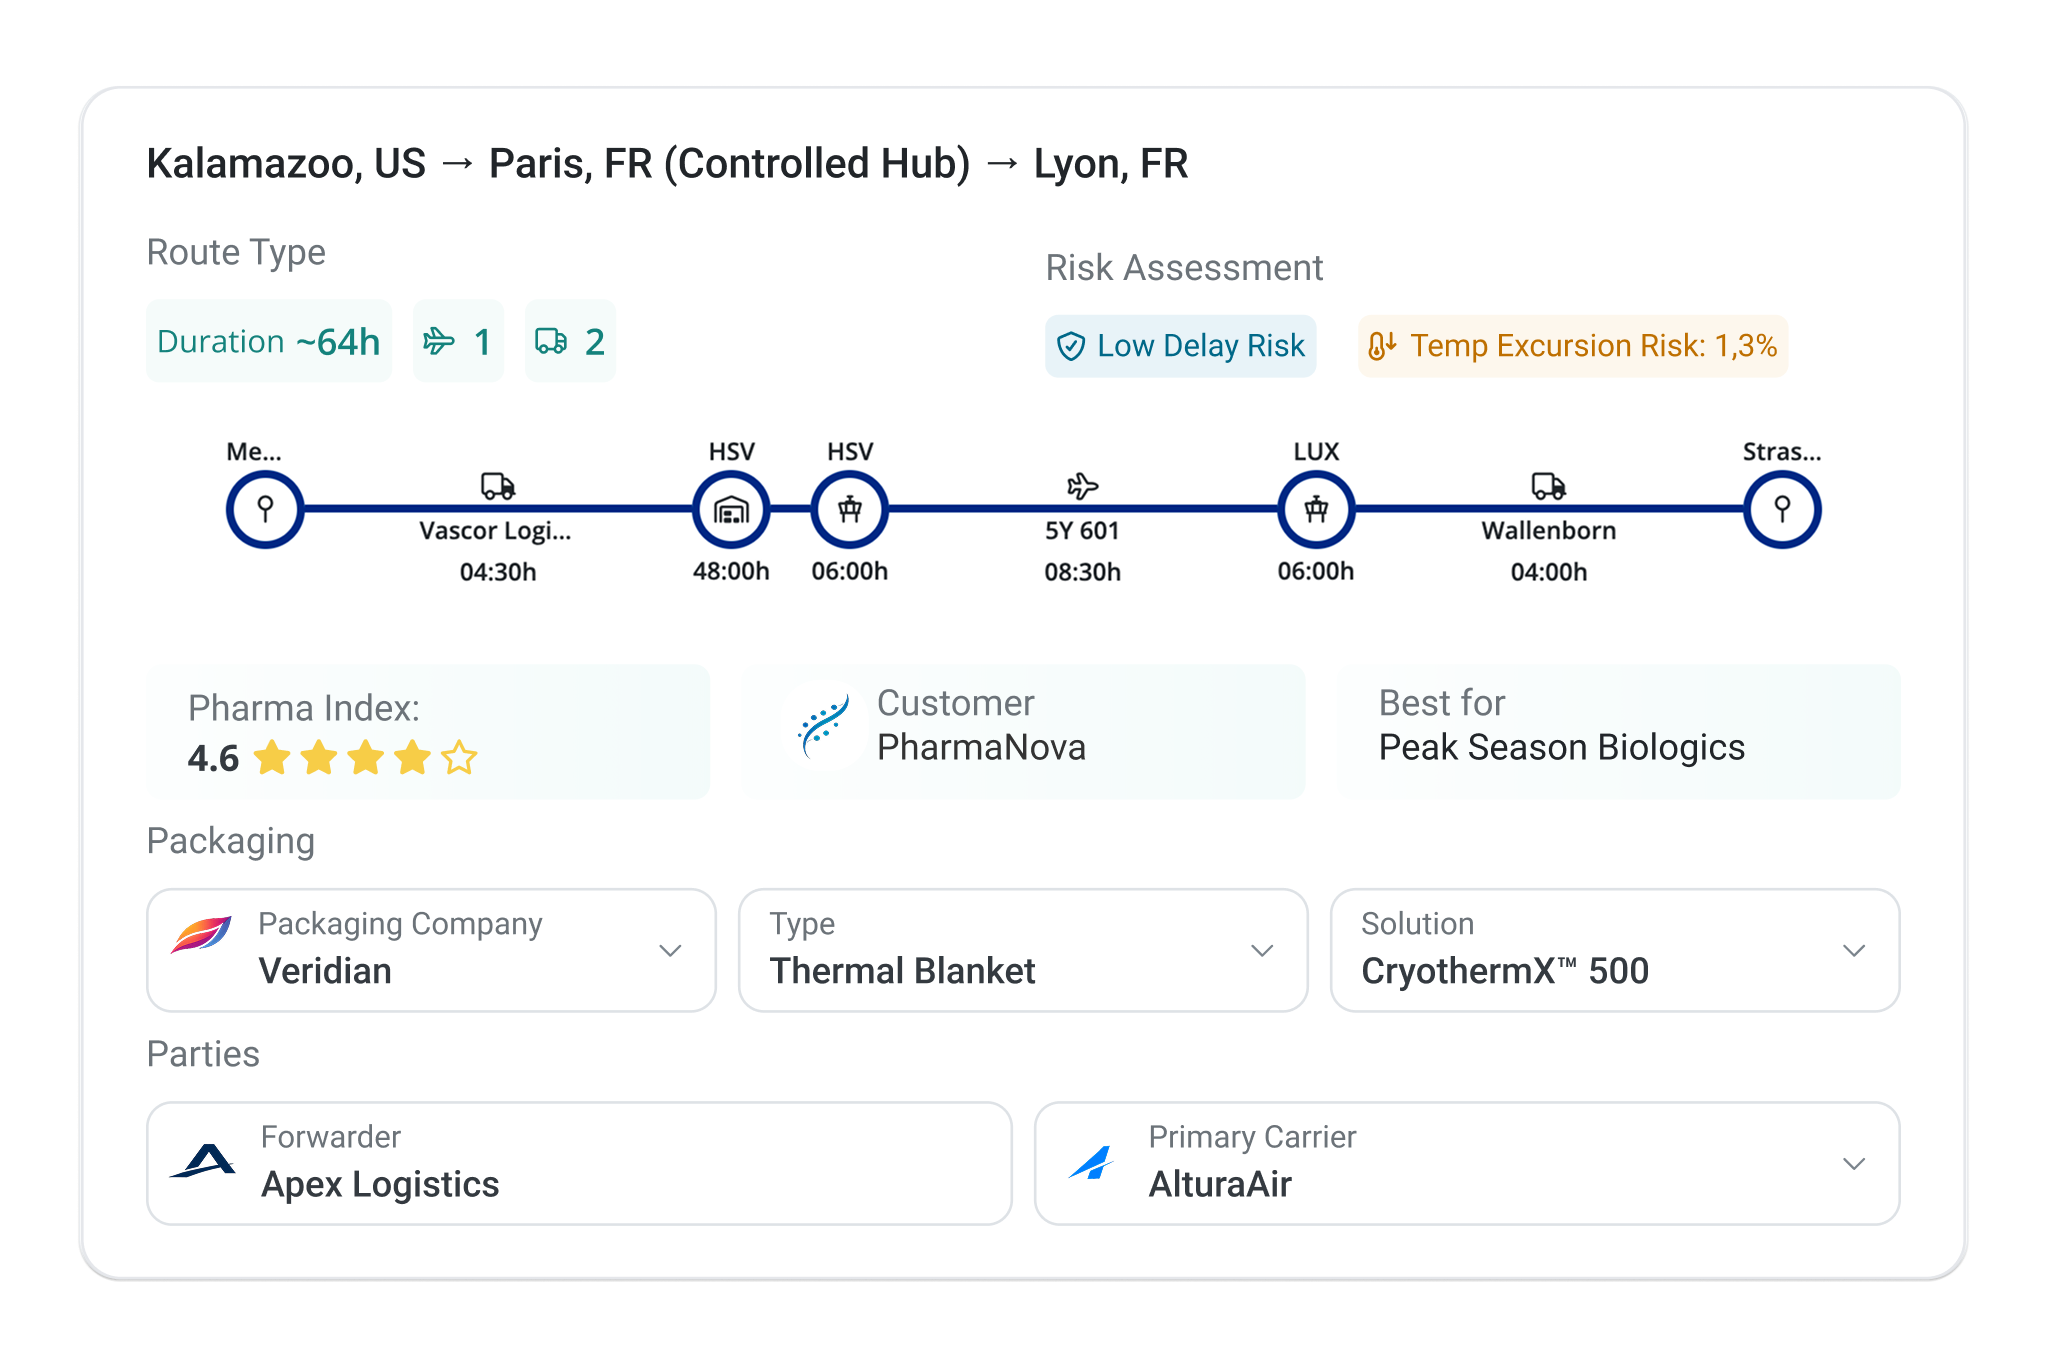
The scale behind it is the part worth sitting with. Validaide has digitized and assessed more than 60,000 pharma shipping lanes, backed by verified data from over 1,900 suppliers, six of the world's top ten pharma companies, and all of the top twenty global freight forwarders. Rhenus reported 90% faster lane creation after switching to data-driven risk assessments. Hellmann delivered more than 250 lane risk assessments in four days during a customer deadline. Pharming's supply chain director put it plainly: their risk assessments finally reflect the real world, not a document that was accurate once.
None of that makes a simulation engine or a monitoring platform the wrong choice for what they're built for. It does mean that "run a lane risk assessment" and "maintain a defensible, current risk view across a global network" are different jobs, and it's worth being honest about which one a team actually needs before choosing a tool for it.
The Actual Question to Answer First
The right lane risk solution depends on what a team is actually trying to defend: one shipment, one lane, or an entire network of them. For the first two, a simulation run or a monitoring dashboard can genuinely be enough. For the third, which is where most pharma manufacturers, forwarders, and carriers actually operate, a shared, continuously updated standard is what makes risk decisions defensible instead of situational.
.jpg?width=4885&height=3257&name=Transport_Air_03%20(1).jpg)